January 14: The current account, which was in surplus since the first four months of the ongoing fiscal year, is now in deficit. It is believed that the rise in import recently has increased the outflow of Nepalese currency resulting in the current account deficit.
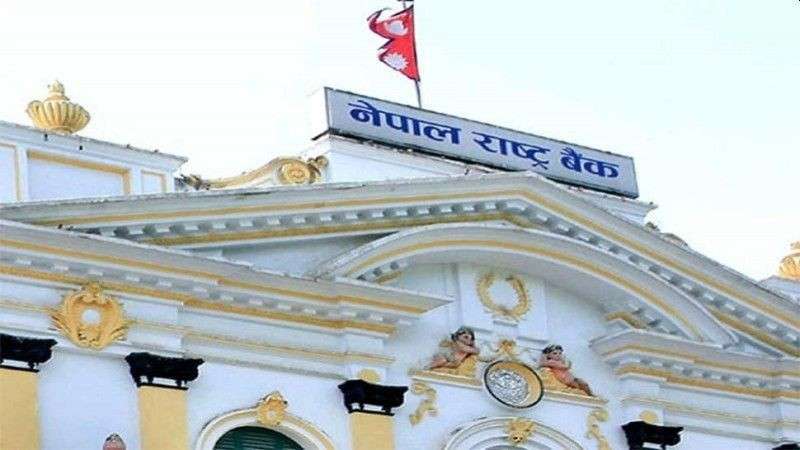
Current Macroeconomic and Financial Situation of Nepal released by Nepal Rastra Bank (NRB) on January 13 states that the current account remained at a deficit of Rs 21.32 billion in the review period compared to a deficit of Rs 65.13 billion in the same period of the previous year.
In the US Dollar terms, the current account recorded a deficit of 182.4 million in the review period compared to a deficit of 572.0 million in the same period of the previous year, NRB stated.
In the review period, capital transfer decreased 16.0 percent to Rs 4.75 billion and net foreign direct investment (FDI) decreased 31.5 percent to Rs 4.50 billion. In the same period of the previous year, capital transfer and net FDI amounted to Rs 5.65 billion and Rs 6.57 billion respectively.
Balance of Payments
Balance of Payments (BOP) registered a surplus of Rs106.48 billion in the review period as compared to a surplus of Rs 23.30 billion in the same period of the previous year. In the US Dollar terms, the BOP recorded a surplus of 896.5 million in the review period compared to a surplus of 205.9 million in the same period of the previous year.
Remittance
According to the central bank, remittance inflow increased 10.9 percent to Rs 416.81 billion in the review period against a decrease of 0.2 percent in the same period of the previous year.
Number of Nepali workers (institutional and individual-new and legalized) taking approval for foreign employment decreased 77.9 percent in the review period. It had increased 11.8 percent in the same period of the previous year. The number of Nepali workers (renew entry) taking approval for foreign employment decreased 69.4 percent in the review period. It had increased 7.6 percent in the same period of the previous year.
Merchandise Trade
In five months of 2020/21, merchandise exports increased 5.1 percent to Rs 50.06 billion compared to an increase of 27.0 percent in the same period of the previous year. Destination-wise, exports to India and other countries increased 8.6 percent and 0.8 percent respectively whereas exports to China decreased 55.2 percent.
Exports of cardamom, jute goods, polyester yarn and threads, noodles, pashmina, among others, increased whereas exports of palm oil, pulses, zinc sheet, woolen carpet, textiles, among others, decreased in the review period.
In five months of 2020/21, merchandise imports decreased 9.6 percent to Rs 525.50 billion compared to a decrease of 4.2 percent a year ago.
Destination-wise, imports from India, China and other countries decreased 1.1 percent, 24.4 percent, and 20.8 percent respectively.
Imports of crude soybean oil, rice, MS billet, telecommunication equipment and parts, coal, among others, increased whereas imports of petroleum products, aircraft spareparts, crude palm oil, other machinery and parts, transport equipment and parts, among others, decreased in the review period.
Based on customs points, exports from Birgunj Dry Port, Biratnagar, Kailali, Tatopani, Kanchanpur and Rasuwa Customs offices decreased whereas exports from all the other customs points increased in the review period. On the import side, imports from all the other customs points decreased except Bhairahawa, Biratnagar, Nepalgunj, Krishnanagar, Kailali and Kanchanpur customs offices in the review period.
Trade Deficit
Total trade deficit narrowed down 10.9 percent to Rs 475.44 billion in five months of 2020/21. Such deficit had contracted 6.3 percent in the same period of the previous year. The export- import ratio increased to 9.5 percent in the review period from 8.2 percent in the same period of the previous year
Consumer Price Inflation
The y-o-y consumer price inflation stood at 2.93 percent in the fifth month of 2020/21 compared to 6.55 percent a year ago. Food and beverage inflation stood at 5.23 percent whereas non-food and service inflation stood at 1.16 percent in the review month.
The price of fruit, ghee and oil, vegetables, and pulses and legumes sub-groups rose 14.75 percent, 13.01 percent, 11.44 percent and 10.74 percent respectively on y-o-y basis.
In the review month, the Kathmandu Valley, Terai, Hill and Mountain witnessed 3.71 percent, 2.35 percent, 3.95 percent and 4.22 percent inflation respectively. These regions had witnessed 7.60 percent, 6.66 percent, 5.27 percent and 4.83 percent inflation respectively a year ago.